

CMMS

Florian Bartholomäus, osapiens Expert | 11. March 2026 | Lesezeit 24 min.
Before you evaluate any reporting tool, ask yourself one question: does it show me why something failed or just that it did? The gap between those two answers is where most maintenance teams lose time, budget, and confidence in their data.
Stop exporting spreadsheets. Start making decisions.







TRUSTED BY LEADING COMPANIES




ENTERPRISE-READY
 SAP Certification
 ISO 27001
 EU Hosting
 Entra ID & Okta
 Multi-Entity
Table of Contents
- Key Facts
- What Is Maintenance Reporting Software?
- Expert tip from osapiens
- What Features Should Maintenance Reporting Software Have?
- The 5 Maintenance Reporting KPIs Every Enterprise Team Should Track
- Best Maintenance Reporting Software Compared
- How to Choose the Right Maintenance Reporting Software for Your Team
- How the osapiens HUB Turns Maintenance Data into Decisions
- Conclusion: Better Data, Better Maintenance
- FAQ
How do you turn thousands of work orders into one clear answer for leadership? Most maintenance leaders know the frustration: it’s Monday morning, and you’re pulling maintenance data from SAP, copying numbers from a spreadsheet, and cross-referencing a third system just to explain why downtime spiked last week. The right reporting tools inside a CMMS can eliminate that scramble entirely. The osapiens HUB for Maintenance was built for exactly this challenge, connecting work orders, costs, and asset performance in a single view.
Key Facts
- Reporting ≠ dashboards: Effective maintenance reporting connects work order data to asset performance, costs, and compliance. Charts on a screen without context don’t drive decisions.
- Data silos kill decisions: Fewer than 40 % of maintenance teams use dedicated KPI tools. Most still rely on spreadsheets and ERP exports that are outdated before they reach leadership.
- Context matters more than volume: The best maintenance software doesn’t just collect data. It links maintenance activities to business outcomes like downtime reduction, preventive maintenance performance and cost per asset.
- SAP integration is a differentiator: For organizations running SAP, SAP-integrated maintenance software eliminates manual data entry and ensures a single source of truth across systems.
- osapiens HUB for Maintenance combines advanced dashboards, multi-site reporting, and SAP-certified integration into one platform built for data-driven maintenance management decisions.
What Is Maintenance Reporting Software?
Maintenance reporting software is not a standalone product you can buy off the shelf. It’s a set of reporting capabilities embedded within CMMS software and EAM platforms. When maintenance managers search for maintenance reporting software, they’re really looking for a CMMS with strong analytics and reporting tools built in.
The quality of these features for preventive maintenance varies dramatically between platforms. Some only offer basic work order counts, while others deliver deep maintenance analytics. Choosing the right one depends on what you need reports to do: inform decisions, prove regulatory compliance, optimize maintenance costs or preventive maintenance compliance.
Why Maintenance Reporting Still Fails: Spreadsheets, Data Silos, and Blind Spots
Picture this: a maintenance manager exports data from SAP, copies work order logs from email into Excel, cross-references costs from the ERP, and spends hours building a report. By the time it reaches leadership, the numbers are already outdated. This isn’t an edge case. For most maintenance operations, it’s Monday morning.
The most common failure points follow a predictable pattern:
- Spreadsheet dependency: Manual data entry, version control issues, and formulas that break the moment someone edits a cell. Spreadsheets weren’t built to manage maintenance data at scale.
- Data silos between systems: Work orders live in one tool, asset data in SAP, and costs in the ERP. Nothing connects automatically, so every report requires manual reconciliation.
- Missing real-time visibility: Reports reflect last week’s reality, not today’s. Maintenance managers make decisions on stale data, and leadership gets a delayed picture of performance.
- No standardized KPIs: Every site defines “downtime” differently and preventive maintenance completion rates are tracked inconsistently, making cross-site comparison meaningless and benchmarking impossible.
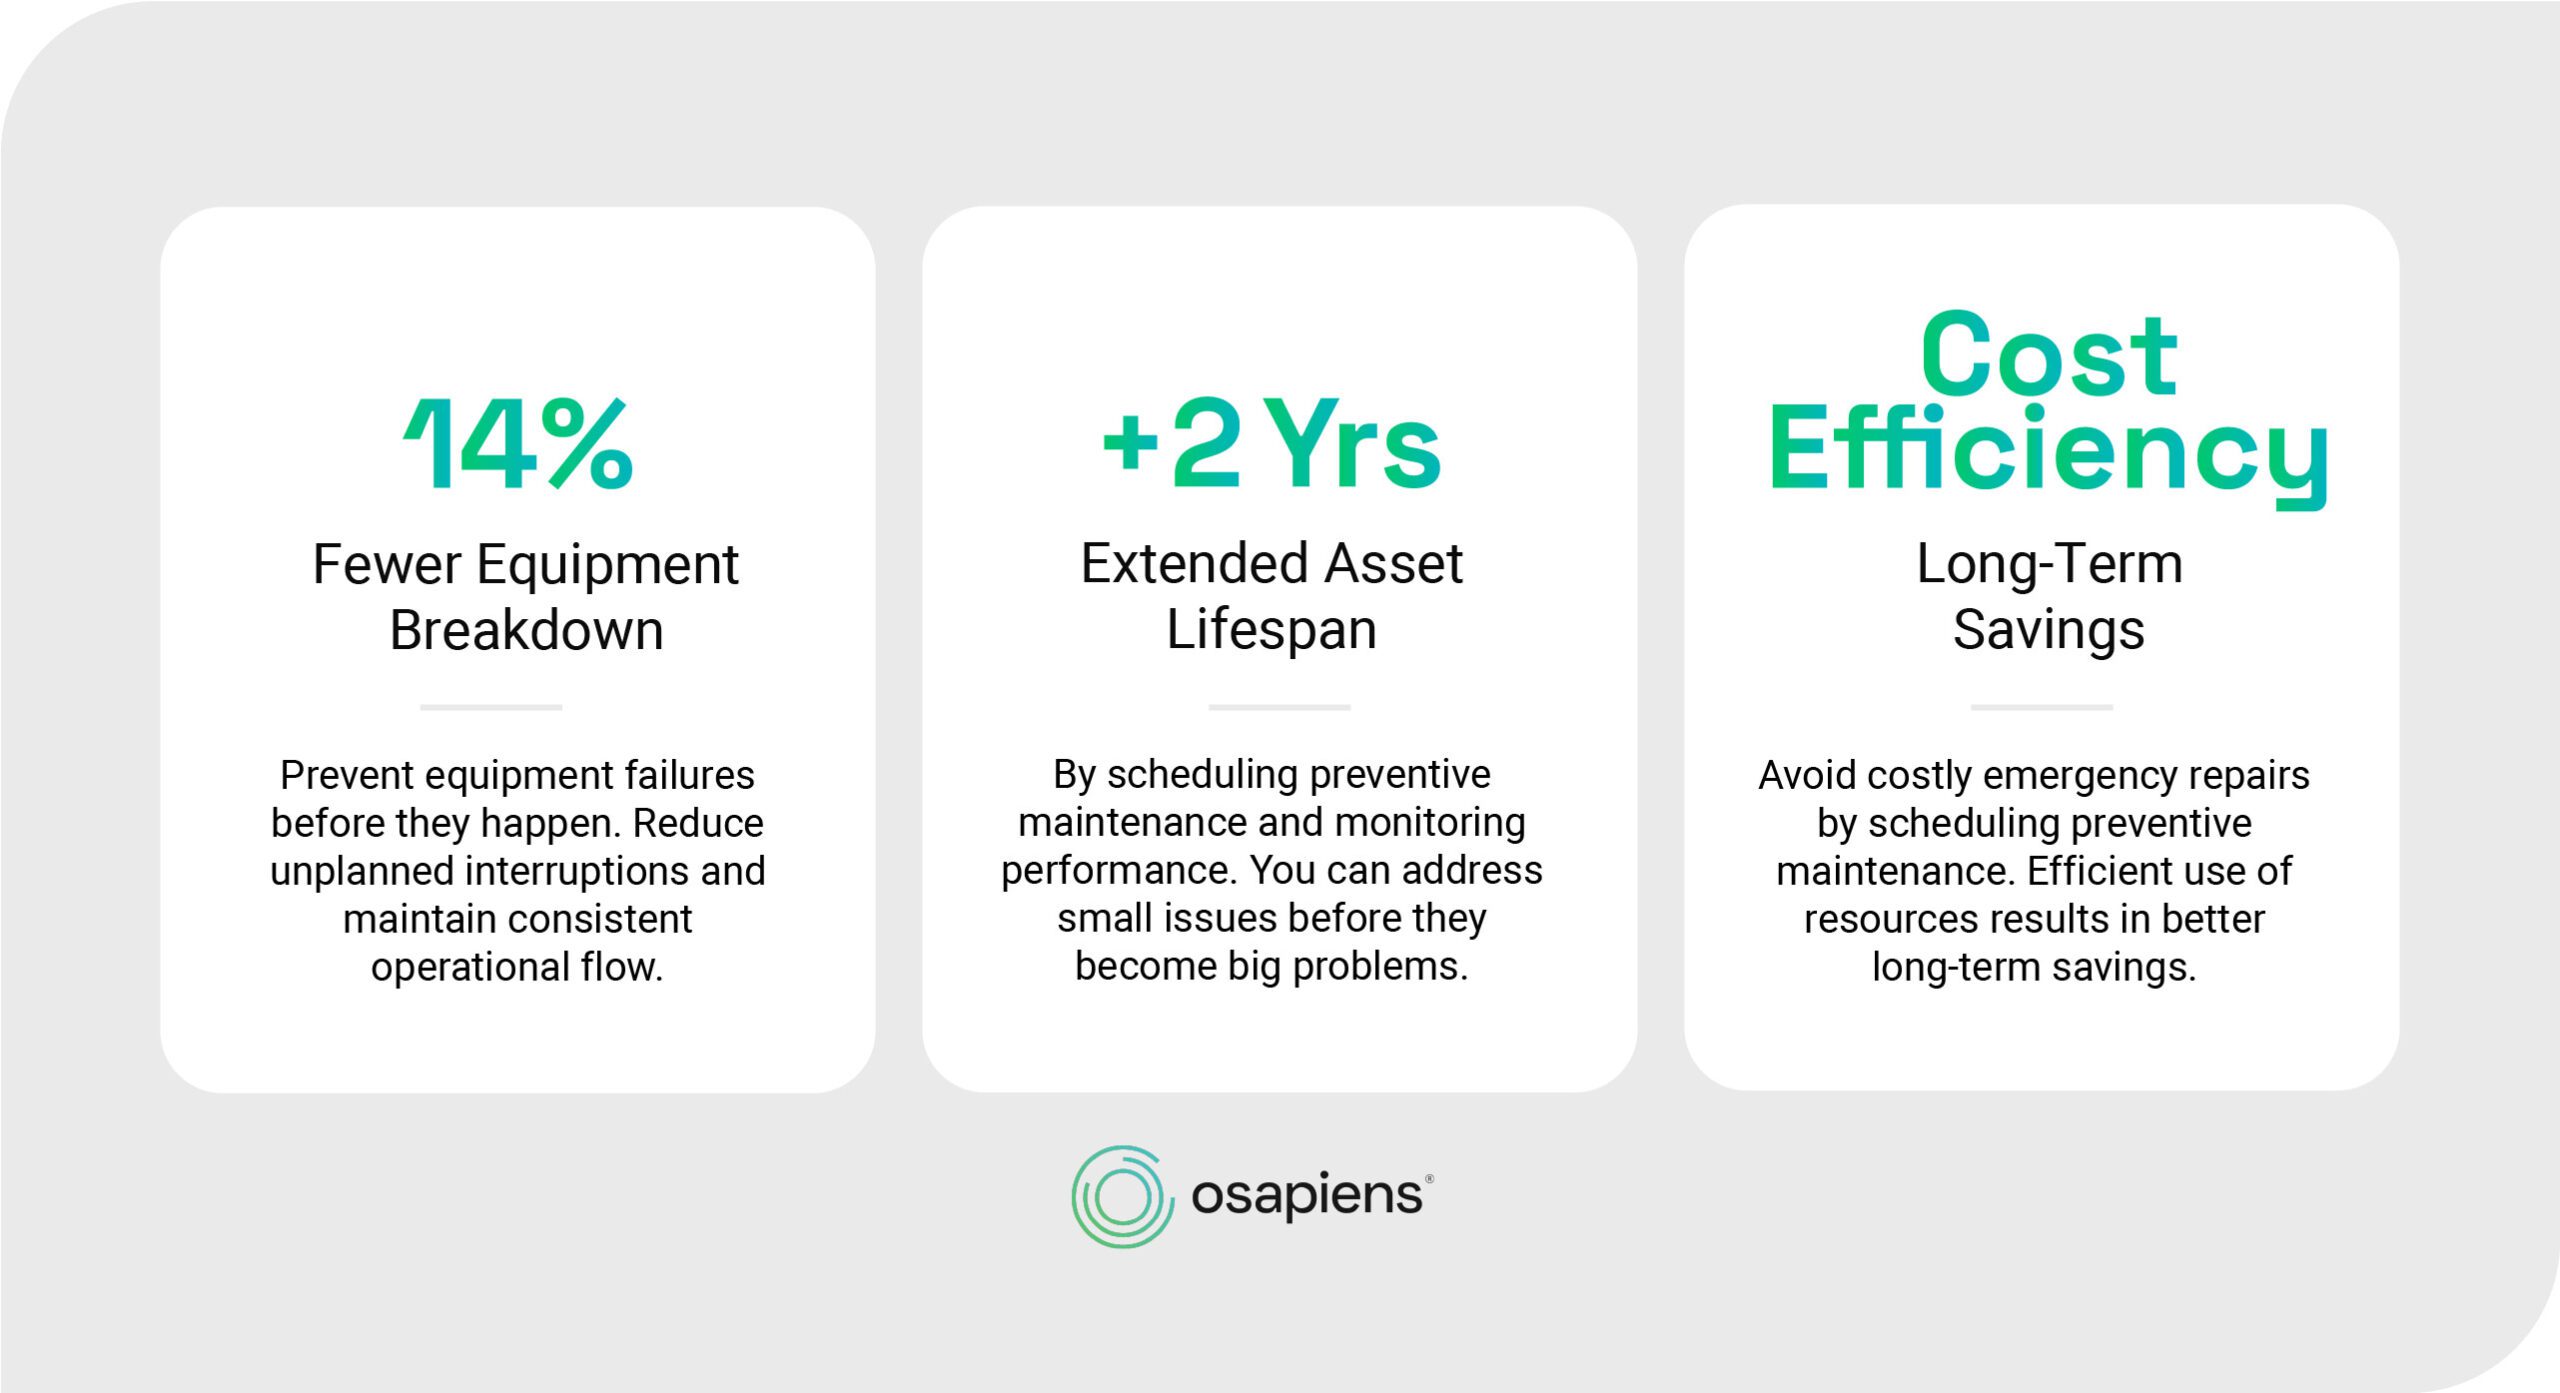
According to the osapiens Industrial Maintenance Report, fewer than 40 % of maintenance organizations use dedicated dashboard or KPI tools. The rest rely on exports and workarounds. Understanding where reporting breaks down is the first step toward identifying the features that actually make a difference.
Expert tip from osapiens
Before you evaluate any reporting tool, ask yourself one question: does it show me why something failed or just that it did? The gap between those two answers is where most maintenance teams lose time, budget, and confidence in their data.
Florian Bartholomäus, osapiens Expert
What Features Should Maintenance Reporting Software Have?
Not every reporting feature delivers equal value. The difference between useful preventive maintenance software and noise comes down to a few core capabilities that connect daily operations to strategic decisions. Here’s what to prioritize when evaluating your options.
1. Real-Time Work Order Tracking
Real-time work order tracking means seeing the status of every open, in-progress, and completed task without refreshing a spreadsheet or waiting for someone to update a shared file. The best maintenance software lets you filter work orders by site, team, priority, or asset, giving maintenance managers immediate visibility into what’s happening across operations.
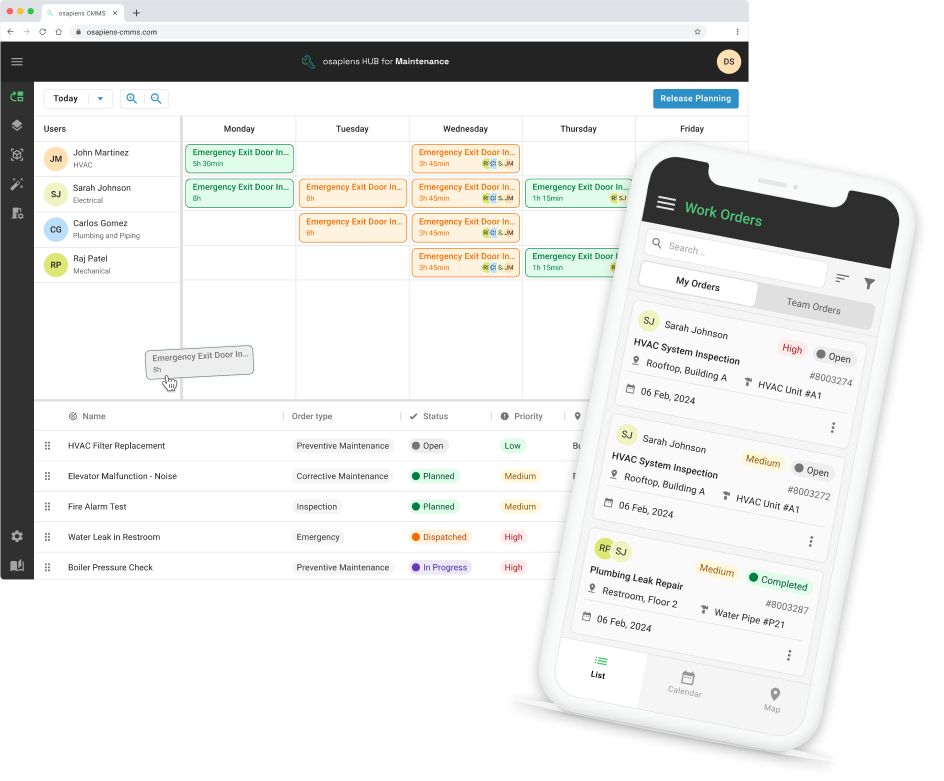
This matters because it enables you to spot bottlenecks the moment they form. If a backlog is building on a specific production line or maintenance requests are piling up at one location, you see it in real time. The osapiens HUB for Maintenance provides this through live dashboards accessible on both desktop and mobile, so managers can track work orders from anywhere.
2. Asset Performance & Downtime Analysis
Strong asset performance reporting tracks the metrics that directly impact equipment reliability: MTBF (mean time between failures), MTTR (mean time to repair), and the ratio of unplanned downtime to planned downtime. These numbers reveal which assets drain the most resources and where preventive maintenance is actually reducing failures.
Comparing asset performance across multiple sites or asset classes helps maintenance leaders identify patterns and allocate budgets more effectively. The osapiens HUB for Maintenance links downtime data directly to work orders and maintenance costs, providing a complete picture rather than isolated numbers. This connection turns raw data into actionable insights for extending asset life and reducing downtime.
3. Technician Productivity & Cost Tracking
Understanding where your maintenance budget goes requires tracking labor hours per work order, cost per asset, and technician utilization rates. This data is essential for resource planning, budget justification, and identifying where operational efficiency can improve. Effective cost tracking should cover:
- Labor cost per work order and per asset
- Parts consumption and inventory cost
- External contractor spend
- Budget variance (planned vs. actual)
Without this level of detail, maintenance departments struggle to justify investments or prove that preventive maintenance scheduling is delivering returns. The right CMMS software makes these numbers available automatically, eliminating manual data entry and spreadsheet reconciliation.
4. Compliance and Audit Trails
For regulated industries like pharma, energy, and food & beverage, reporting isn’t optional, it’s a legal requirement. Maintenance software needs to capture time-stamped task completions, e-signatures, inspection records, and exportable audit trails that satisfy regulatory compliance standards.
The osapiens HUB for Maintenance automatically documents every maintenance activity with timestamps and user attribution. This makes audit preparation straightforward rather than a multi-day scramble through paper records and disconnected systems. For pharmaceutical operations, it ensures that safety compliance and documentation meet the strictest industry standards.
The 5 Maintenance Reporting KPIs Every Enterprise Team Should Track
Reporting software is only as useful as the KPIs it standardizes. These five show up in nearly every serious CMMS evaluation, and each needs a consistent definition across every site before cross-location comparison means anything.
| KPI | Formula | What It Shows |
|---|---|---|
| MTTR | Total repair time ÷ number of repairs | How quickly a team restores a failed asset to service. A rising MTTR usually points to parts availability problems or gaps in technician diagnostic support, not technician effort. |
| MTBF | Total operating time ÷ number of failures | Asset reliability. A higher MTBF means fewer failures per operating hour, the metric preventive maintenance programs are meant to move. |
| OEE | Availability × Performance × Quality | How much of an asset’s full production potential is actually realized, combining downtime, speed loss, and defect rate into one number. |
| Asset availability | (Total scheduled time − downtime) ÷ total scheduled time | The percentage of time an asset is actually ready to produce, the baseline number most downtime-reduction business cases are built on. |
| Maintenance cost per asset | Total maintenance cost (labor + parts + contractor spend) ÷ number of assets | Where the maintenance budget concentrates, and which assets are quietly becoming cost sinks worth a repair-vs-replace decision. |
Any serious CMMS reporting dashboards enterprise evaluation, IBM Maximo, SAP PM, Fiix, UpKeep, Limble, and eMaint included, should calculate all five automatically from work order data, without manual spreadsheet formulas. The osapiens HUB for Maintenance ships all five as standard, no-code dashboard widgets.
Evaluating Asset Failures and Maintenance Costs Across Sites
A CMMS reporting dashboards multi site enterprise software rollout only works if every site feeds the same definitions into the same KPIs. The most common failure in multi-site maintenance reporting isn’t a missing dashboard, it’s inconsistent inputs: one site logs downtime in minutes, another in shifts; one site counts a work order as “corrective” when the same failure type is “unplanned” elsewhere.
The osapiens HUB for Maintenance standardizes the five KPIs above (MTTR, MTBF, OEE, asset availability, cost per asset) at the definition level, not just the dashboard level, so a maintenance director comparing 12 facilities is comparing identical calculations, not 12 different spreadsheets that happen to use the same axis labels. Site-level rollups surface which locations are outperforming on cost per asset, where failure patterns cluster, and which sites need budget reallocated toward preventive maintenance instead of reactive repair.
Best Maintenance Reporting Software Compared
Choosing maintenance reporting software depends on how well it handles key features: reporting depth and custom KPI dashboards, SAP or ERP integration, scalability across multiple sites, mobile access for field teams, and ease of report customization. The comparison below focuses on platforms most relevant to mid-size and enterprise maintenance teams that need reporting to drive real operational decisions.
| Feature | osapiens HUB | MaintainX | UpKeep | IBM Maximo | Fiix | eMaint | Limble |
|---|---|---|---|---|---|---|---|
| Custom KPI Dashboards | ✅ Advanced, multi-site | ✅ | ✅ | ✅ | ⚠️ SQL-based | ✅ | ✅ |
| SAP Integration | ✅ Certified, bidirectional, included | ⚠️ SAP Partner, Enterprise + paid add-on | ⚠️ Enterprise tier, standard workflows | ⚠️ Official connector, config-heavy | ⚠️ SAP Build Partner, added cost | ⚠️ Real integration, not certified | ⚠️ Procurement-only, custom dev for more |
| Multi-Site Benchmarking | ✅ Built-in | ✅ | ⚠️ | ✅ | ⚠️ Paid tier | ⚠️ | ⚠️ 2–10 sites |
| Mobile Reporting Access | ✅ Mobile-first | ✅ | ✅ | ⚠️ | ✅ | ✅ Offline mode | ✅ |
| Cost Tracking per Asset | ✅ Labor + Parts + Downtime | ✅ | ✅ | ✅ | ✅ | ✅ | ✅ |
| Ease of Report Customization | ✅ No-code | ✅ | ⚠️ | ❌ | ❌ SQL required | ⚠️ | ⚠️ Capped |
| Best For | SAP environments, mid-to-enterprise | Mobile-first teams | Smaller teams | Large enterprise | Dispersed assets, in-house SQL | Mid-market, compliance | Few, similar sites |
✅ Available / strong ⚠️ Limited / with caveats ❌ Not available
* Comparison based on publicly available product information and user reviews.
The osapiens HUB for Maintenance bridges the gap between complex enterprise systems like IBM Maximo and simpler tools like UpKeep. It delivers enterprise-grade reporting and multi-site benchmarking through a modern, user-friendly interface, while its native SAP-certified integration eliminates the data silos and manual exports that slow down maintenance teams in SAP environments.
1. The osapiens HUB: SAP-Native CMMS with Enterprise Reporting
The osapiens HUB for Maintenance was built to close the gap that most CMMS platforms leave open: enterprise-grade reporting in a modern, user-friendly interface with certified SAP integration that works out of the box.
Where MaintainX and UpKeep stop at the CMMS boundary, and Maximo demands months of implementation work, the osapiens HUB connects natively to SAP PM while remaining fully functional as a standalone platform for teams without SAP. More than 2,500 organizations worldwide rely on the platform, including Coca-Cola North America across 35 North American facilities and Nordex managing 11,400 wind turbines globally.
Key strengths:
- SAP-certified integration with bidirectional real-time synchronization between the osapiens HUB and SAP PM, ensuring that asset master data, work orders, and cost postings stay consistent across both systems without manual exports or duplicate data entry.
- No-code dashboard customization that lets maintenance managers build and adjust KPI views without IT support, combined with built-in multi-site benchmarking that standardizes performance metrics across all locations for meaningful cross-site comparison.
- Mobile-first design with native iOS and Android apps that support full offline functionality, so technicians can complete work orders, checklists, and inspections in production environments without reliable internet connectivity.
- Fast implementation with typical timelines of 1–3 weeks for standalone deployment and 4-12 weeks including SAP integration – significantly shorter than traditional enterprise platforms and without the need for a dedicated IT project team.
- Transparent pricing with a free tier for up to 5 users, giving smaller teams access to enterprise-grade functionality without upfront investment and allowing organizations to evaluate the platform before committing to a broader rollout.
Limitations:
- Best suited for organizations with structured maintenance processes already in place. Teams that are just beginning their digitalization journey may want to start with the free trial to build familiarity with the platform before rolling it out more broadly.
Best for: SAP environments, mid-to-enterprise maintenance teams, and organizations that need enterprise-grade reporting depth without the implementation complexity or IT overhead of traditional EAM platforms.
Pricing: Free up to 5 users, then 29–49 € per user/ month
Try the osapiens HUB
No IT project required. Get started in minutes and see enterprise-grade maintenance reporting in action.
Start for free
2. MaintainX: Mobile-First CMMS for Frontline Maintenance Teams
MaintainX is a US-based CMMS built primarily for frontline maintenance teams that need a fast, intuitive way to manage work orders and track basic reporting on mobile. The platform has gained strong traction among smaller operations and facilities teams moving away from paper or spreadsheets. Its strength lies in simplicity and speed of adoption, not in reporting depth or enterprise integration.
Key strengths:
- Intuitive mobile-first interface with native iOS and Android apps that allow technicians to create, update, and complete work orders directly from the shop floor, reducing administrative back-and-forth with the office.
- Visual dashboards with pre-built KPIs for work order volume, completion rates, and asset history that give maintenance managers a clear operational overview without requiring configuration or IT support.
- Fast onboarding with minimal setup, making it one of the quickest CMMS platforms to deploy for small to mid-size teams that need to get started without a lengthy implementation project.
Limitations:
- No certified SAP integration, meaning work order data, asset information, and maintenance costs don’t flow automatically into SAP PM. Every report that crosses the system boundary requires manual exports and reconciliation, creating exactly the data silos that reporting is supposed to eliminate.
- Reporting depth is limited for complex or multi-site operations. Teams that need cross-site benchmarking, custom KPI dashboards, or cost tracking at the asset level will quickly hit the ceiling of what MaintainX can deliver.
Best for: Mobile-first teams and smaller operations without SAP that prioritize ease of use and fast setup over deep reporting or enterprise integration.
Pricing: Free tier available; paid plans from $20 per user / month up to $65 per user / month; Enterprise pricing on request.
3. UpKeep: Visual Dashboards for Teams Getting Started with CMMS Reporting
UpKeep offers clean visual dashboards and straightforward KPI tracking that work well for maintenance teams taking their first steps with dedicated software. Setup is fast and the interface requires little training, making it a popular choice for facilities and property management teams. For organizations that outgrow basic reporting or operate across multiple sites, however, its limitations become apparent quickly.
Key strengths:
- Out-of-the-box KPI dashboards covering work order completion rates, asset downtime, and basic cost tracking, giving maintenance managers immediate visibility without any configuration work.
- Strong mobile access via iOS and Android apps that support work order management, asset lookups, and photo documentation, making it a practical tool for technicians who need information at the point of work.
- Quick deployment with a low learning curve, allowing smaller maintenance teams to get up and running in days rather than weeks without relying on IT resources.
Limitations:
- Limited customization depth for more advanced reporting needs, with no no-code dashboard builder for teams that want to track KPIs beyond the pre-configured defaults.
- No certified SAP connectivity, which means maintenance data stays siloed from enterprise systems and requires manual exports for any report that needs to reflect costs or asset data from SAP.
- Multi-site benchmarking requires additional configuration that becomes increasingly cumbersome at scale, making it a poor fit for organizations managing maintenance across multiple locations.
Best for: Smaller maintenance teams in facilities and property management that need visual reporting without complex setup and don’t operate in an SAP environment.
Pricing: From $20 per user / month; Premium at $55 per user / month; advanced tiers on request.
4. IBM Maximo: Enterprise Asset Management for Large, Complex Operations
IBM Maximo is one of the most established enterprise asset management platforms on the market, with deep reporting capabilities and broad support for complex asset structures across industries. For large organizations with dedicated IT resources and long implementation horizons, it delivers a level of depth that few platforms match. That depth, however, comes at a cost: in complexity, implementation time, and day-to-day usability for technicians.
Key strengths:
- Enterprise-grade asset lifecycle management supporting detailed asset structures, maintenance strategies, work order processing, and inventory management across large and distributed asset portfolios, making it one of the most functionally complete EAM platforms available.
- Advanced analytics and reporting through built-in Cognos reporting, enabling real-time insights and customizable dashboards that display critical KPIs across complex operations with multiple asset classes and locations.
Limitations:
- Complex setup and configuration requiring specialized IT skills and extended implementation timelines, particularly for advanced analytics and custom integrations. For mid-size organizations without a dedicated IT team, this depth quickly becomes a barrier rather than an advantage.
- Higher total cost of ownership compared to modern CMMS platforms, both in licensing and in the ongoing IT resources required to maintain, customize, and update the system.
- Dated user interface that makes technician adoption a persistent challenge, with many organizations reporting that field teams revert to manual processes rather than navigating a system that wasn’t designed with usability in mind.
- SAP integration is technically possible but requires additional configuration effort and lacks the bidirectional real-time synchronization of a certified connector, which is a meaningful gap for organizations where SAP is the system of record.
Best for: Large enterprises with dedicated IT teams, complex asset portfolios across multiple industries, and the organizational resources to manage a long, complex implementation.
Pricing: Pricing on request. Based on publicly available market data, enterprise contracts are typically a significant investment but exact costs vary depending on deployment model, customization scope, and support requirements.
5. Fiix: SMB-Focused CMMS with Tiered Reporting Depth
Fiix is a cloud-based CMMS built for small and mid-size maintenance teams, particularly those with geographically dispersed assets. Reporting depth scales sharply with the plan tier, standard reports ship on the Basic plan, while custom analytics and multi-site management sit behind Professional and above.
Key strengths:
- Comprehensive reports and dashboards tracking uptime, MTTR, and maintenance KPIs, extendable through a SQL-based custom report builder on Professional and Enterprise tiers.
- Fiix Foresight AI analyses maintenance history to forecast parts needs and flag recurring breakdown patterns.
- Mobile app with offline sync for technicians completing work orders without a live connection.
Limitations:
- The custom report builder requires SQL knowledge, and reviewers describe the reporting structure as difficult to configure into the operational KPI views maintenance managers actually need.
- ERP connectivity is an added cost even on Enterprise: the Integration Hub and custom API integrations sit outside the base subscription, so teams needing SAP or ERP data flow should model the real cost before comparing to certified-connector platforms.
- Multi-site management and custom analytics require the $75/user/month Professional tier, a large step up from the $45 Basic tier.
Best for: Small to mid-size teams with dispersed assets that can invest configuration time into the SQL-based report builder.
Pricing: Free tier available; Basic from $45 per user/month; Professional from $75 per user/month; Enterprise on request.
6. eMaint: Fluke-Backed CMMS with Configurable Enterprise Reporting
eMaint (owned by Fluke) targets KPI tracking directly, dashboards cover uptime, MTTR, OEE, and work-completion rates out of the box, with regulatory audit trails and e-signatures for compliance-heavy environments.
Key strengths:
- Built-in dashboards for uptime, MTTR, OEE, and completion-rate tracking without third-party BI tools.
- Regulatory compliance tooling: audit trails, approval workflows, and password-protected e-signatures.
- Over 100 catalogued integrations plus native Excel import/export for reporting workflows.
Limitations:
- Reports are shared enterprise-wide across sites by default, which reviewers report as a real risk: one Capterra reviewer described another site accidentally deleting customized cross-site reports, requiring days of manual rebuilding.
- Advanced reporting has a genuine learning curve; users across G2, Capterra, and SoftwareAdvice consistently note needing support to configure advanced reports.
- No free tier, and evaluation requires a sales conversation rather than self-serve signup.
Best for: Mid-market teams that want KPI dashboards (MTTR, OEE) pre-built, and can absorb a support-assisted setup for advanced reporting.
Pricing: Starting price varies by source, roughly $33 to $69 per user/month depending on tier and contract; implementation and advanced-analytics customization typically add $2,000–15,000 and $500–5,000/month respectively.
7. Limble: Fast-Deploy CMMS with Capped Reporting on Entry Tiers
Limble is known for ease of use and rapid deployment, particularly among mid-market manufacturers, with a mobile app that reviewers consistently cite as its strongest feature.
Key strengths:
- Custom dashboards accessible to non-technical users on paid tiers, covering work order completion, PM compliance, asset downtime, and technician performance.
- iOS and Android app with offline mode, QR code asset scanning, and automatic sync on reconnection.
- Multi-site support with a single login across locations for operations managing two to ten sites.
Limitations:
- Advanced analytics are capped at 3 reports per month on the Standard tier, workable for small teams but a fast bottleneck for daily KPI visibility.
- Cross-site KPI benchmarking has real limits for large portfolio operators: reviewers note it works well for 2–10 similar sites but strains at larger, more heterogeneous multi-site scale.
- No published flat pricing, a calculator adjusts by user count and billing cycle, complicating budget comparison.
Best for: Mid-market manufacturers running a handful of similar sites that prioritize fast deployment and mobile usability over deep cross-site analytics.
Pricing: Standard from roughly $28 per user/month; higher tiers (Professional/Premium+) run $55–69 per user/month depending on source; billed annually.
How to Choose the Right Maintenance Reporting Software for Your Team
Every CMMS software reporting maintenance KPIs enterprise asset management evaluation comes down to the same five questions. Answer them before comparing feature lists, and the right platform for your situation becomes obvious.
| If your priority is… | Look for… | Best fit |
|---|---|---|
| Certified, bidirectional SAP sync, not a generic API someone has to maintain manually | A certified connector, not custom middleware | osapiens HUB; IBM Maximo (with heavy configuration) |
| Comparing KPIs across many sites on identical definitions | Centrally standardized KPI definitions, not per-site dashboards | osapiens HUB; IBM Maximo |
| Fast go-live without a dedicated IT project team | 1 to 3 weeks standalone, 4 to 12 weeks with SAP integration | osapiens HUB; MaintainX; UpKeep |
| Maintenance managers self-serving new reports without IT | A no-code dashboard builder | osapiens HUB; MaintainX |
| In-house SQL skills and dispersed small-site assets | A flexible, code-based custom report builder | Fiix |
| Compliance-heavy, audit-driven reporting with e-signatures | Built-in regulatory audit trails | eMaint |
| A handful of similar sites, fast deployment over deep analytics | Simple, mobile-first setup | Limble |
Why SAP Users Need a Different Reporting Standard
For organizations running SAP, the table above tells a clear story: certified SAP integration is the dividing line. MaintainX and UpKeep are well-designed platforms for mobile-first teams, but neither offers certified SAP integration. That means work orders, cost postings, and asset data don’t flow automatically between the CMMS and SAP PM. Every report that crosses the boundary between systems requires a manual export, a reconciliation step, or a workaround that someone on the team has to maintain.
IBM Maximo solves the integration problem at the enterprise level, but introduces a different one: reporting customization requires technical expertise, and implementation timelines stretch from months to over a year for complex deployments. For mid-size organizations that need strong reporting without a dedicated IT team to configure it, Maximo’s depth becomes a barrier rather than an advantage.
The osapiens HUB for Maintenance occupies a different position. It connects natively to SAP PM via certified connector meaning asset master data, work orders, and cost postings stay synchronized automatically, in both directions, without manual intervention. At the same time, it operates as a fully standalone CMMS for organizations that don’t run SAP, or that want to preserve flexibility as their ERP landscape evolves. The result is reporting that reflects the full operational picture, not just what lives inside one system.

Alberto Ecre, Group Lead Service Digitalization Department
★ ★ ★ ★ ★Nordex
“We were looking for a cloud platform solution that supports all of our regions. Our technicians have to visit the wind turbines every day to fix problems—we need stable solutions that make their work easier. The key was the very simple integration with our ERP system. Now we are gradually expanding: subcontractor management, tool management, and more.”
How the osapiens HUB Turns Maintenance Data into Decisions
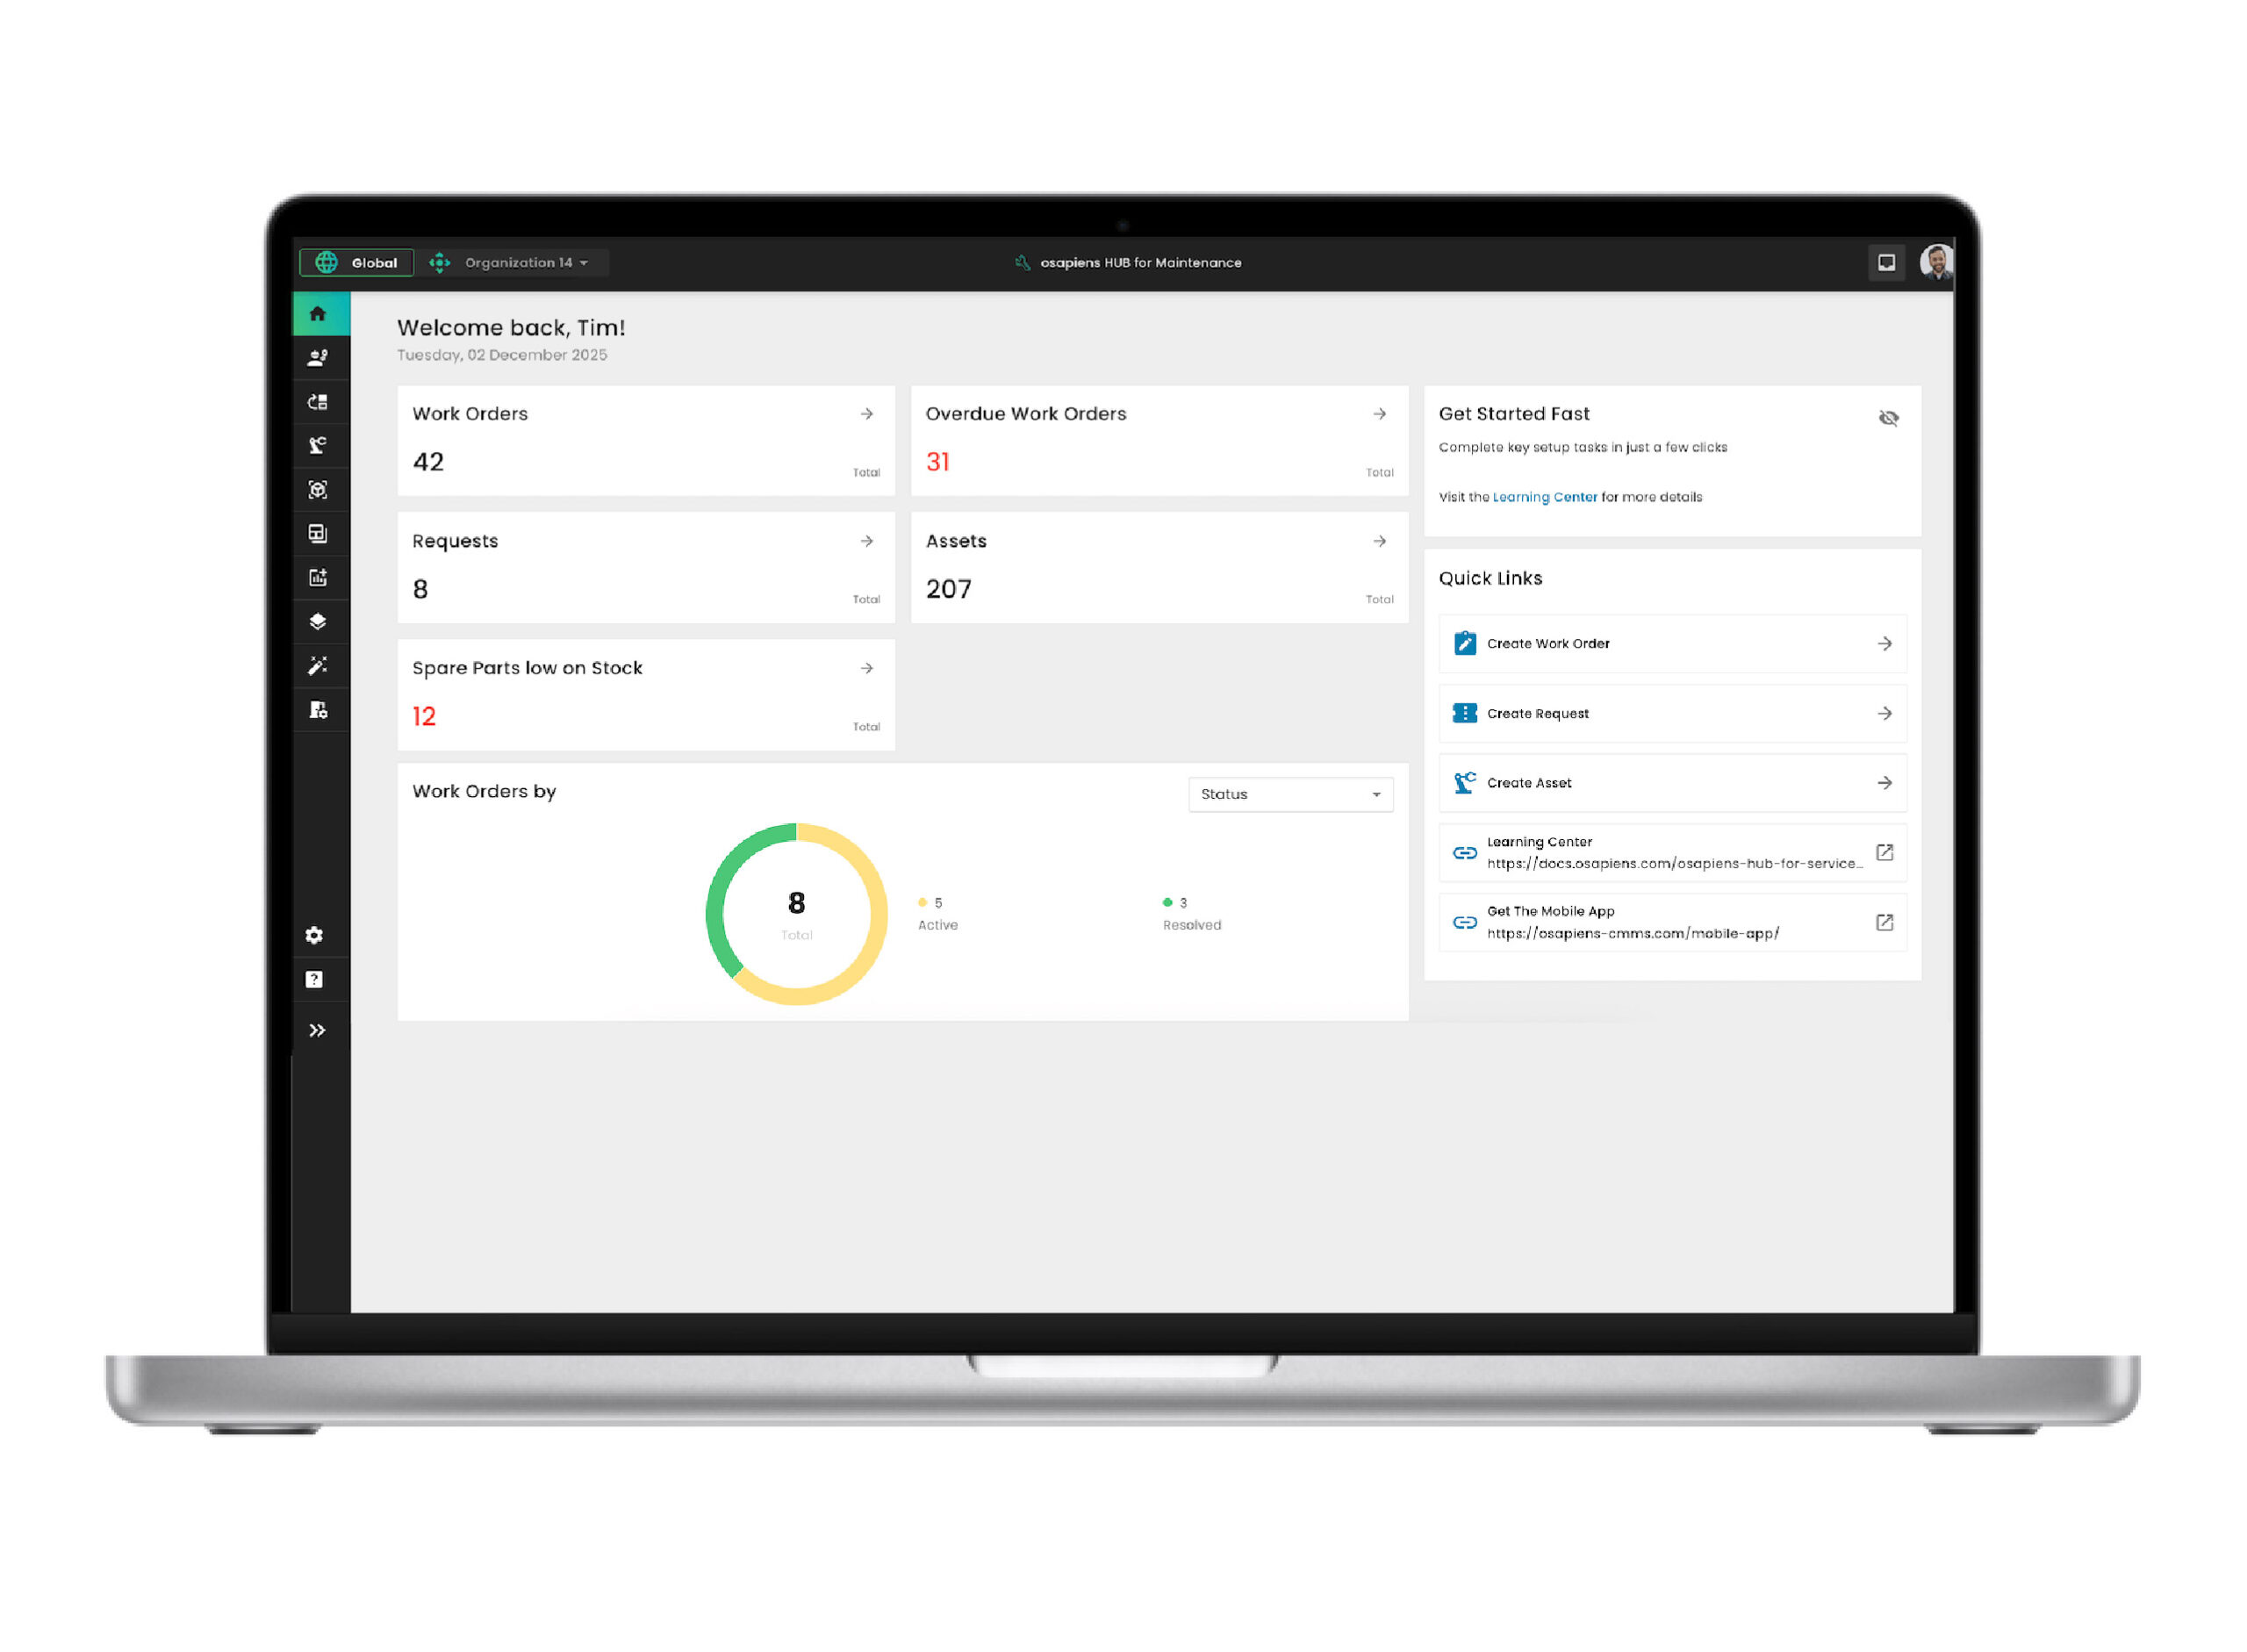
Most CMMS platforms collect data, the osapiens HUB for Maintenance is built to make that data usable. It connects work orders, asset performance, and maintenance costs into a single platform designed for operational and strategic decision-making, from technicians on the shop floor to maintenance leaders presenting to the boardroom.
Advanced Dashboards & KPI Tracking: Open the osapiens HUB on a Monday morning and your maintenance picture is already there. No exports, no manual updates. Maintenance managers see live KPI widgets, filter by site or asset class in seconds, and share views directly with leadership without involving IT or an external BI tool. Every dashboard is built for action, not just visibility.
Cost Tracking Across Labor, Parts, and Downtime: Every work order automatically captures labor hours, parts consumed, and associated costs, rolling up to asset-level and site-level views in real time. Maintenance leaders see exactly where budgets are spent and where savings are possible, without a single spreadsheet.
Multi-Site Reporting & Benchmarking: The osapiens HUB standardizes KPIs across all locations, so managers can compare sites on equal footing and identifying which facilities outperform, where recurring issues cluster, and where to reallocate resources. Isolated site data becomes a connected operational picture.
SAP-Certified Integration: The osapiens HUB connects natively to SAP PM, ensuring that asset master data, work orders, and cost postings stay synchronized with your existing systems. No duplicate entries, no manual exports. Just one connected data flow that keeps reporting accurate and up to date across your enterprise resource planning landscape.
Conclusion: Better Data, Better Maintenance
The gap between collecting maintenance data and acting on it is where most reporting efforts stall. Teams that close it, standardized KPIs, connected work orders, and a single source of truth across SAP and the CMMS, make faster decisions with fewer surprises at month-end.
Choosing the right platform comes down to where your organization stands today: how deeply SAP is embedded in your processes, how many sites you need to compare, and how much reporting depth your team can realistically maintain without IT support. For SAP-driven, multi-site operations, SAP-certified integration removes the manual reconciliation that keeps reports perpetually out of date, and the osapiens HUB for Maintenance is built specifically for that scenario.
Maintenance Reporting That Actually Drives Decisions
Real-time dashboards, SAP-certified integration, multi-site benchmarking, and cost tracking: all in one platform built for maintenance teams that need clarity, not complexity.
Get started with osapiens
FAQ
How do Fiix, eMaint, and Limble compare on enterprise reporting depth?
Fiix offers a flexible, SQL-based custom report builder best suited to teams with in-house technical skills. eMaint ships pre-built dashboards for MTTR, MTBF, and OEE out of the box, with strong regulatory audit trails for compliance-heavy environments. Limble prioritizes fast deployment and mobile usability but caps advanced analytics at 3 reports per month on its entry tier. None offers certified SAP integration, all three require a generic API connection for organizations running SAP PM.
How can a maintenance director compare KPIs consistently across multiple sites?
Consistency starts at the definition level, not the dashboard level: every site needs to calculate MTTR, MTBF, OEE, asset availability, and cost per asset the same way before any cross-site comparison means anything. The most common failure isn’t a missing report, it’s one site logging downtime in minutes and another in shifts. The osapiens HUB for Maintenance standardizes these five KPIs centrally across every location, so a director comparing 12 facilities is comparing identical calculations, not 12 spreadsheets that happen to share axis labels.
Which maintenance KPIs should software track automatically, and which are most commonly overlooked?
Essentials include MTTR, MTBF, preventive maintenance compliance, and cost per asset. Any serious equipment maintenance platform should deliver these out of the box. What gets overlooked more often are the planned vs. unplanned maintenance ratio, backlog age, and first-time fix rate. These three reveal how reactive a team actually is, how long unresolved work orders are quietly building risk, and how efficiently technicians resolve issues on the first visit. The best maintenance software calculates all of this automatically from work order data, without manual input or spreadsheet formulas.
Can maintenance reporting software integrate with SAP without a lengthy IT project?
Yes, if the platform offers certified SAP integration rather than a generic API connection. APIs require custom development, break during SAP updates, and need ongoing IT resources to maintain, the opposite of what maintenance teams need. A certified connector is validated against SAP’s own standards and survives system updates without manual intervention. The osapiens HUB for Maintenance connects natively to SAP PM with typical implementation times of 4 to 12 weeks including the SAP integration, so maintenance data flows automatically between systems from day one.
How does maintenance reporting software help multi-site operations get a unified view of performance?
The core problem in multi-site operations is inconsistency: every facility defines KPIs slightly differently, tracks data in different formats, and reports on different cycles, making meaningful comparison nearly impossible. Good maintenance management software solves this by standardizing definitions across all locations from the start. Preventive maintenance compliance means the same thing at every site, and maintenance costs roll up into a single view without manual normalization. The osapiens HUB for Maintenance builds this cross-site benchmarking in natively, so managers can identify which facilities outperform and where to reallocate resources based on data, not gut feeling.
Start using osapiens for free
Improve your uptime, extend the life of your equipment, and simplify work order management.
Book a demo
ENTERPRISE CAPABILITIES
- SAP ECC & S/4HANA Certified
- Infor & MS Dynamics
- Microsoft Entra ID / Okta
- ISO 27001 & 9001
- EU Cloud · Data Sovereignty
- Development, Test, and Production Environments
- Multi-Entity & Multi-Site
- Power BI Integration
- Audit Trail & Compliance
Related content
January 1, 2026
Dust Collector Maintenance Checklist – Tasks, Safety & Digital Execution
January 1, 2026
CNC Machine Maintenance Checklist: What to Inspect, When & How

June 23, 2026
Best Cloud-Based Inventory Management Software: Top 5 Comparison 2026
January 1, 2026
Batching Plant Maintenance Checklist – Tasks, Tips & Template
January 1, 2026
Emergency Lighting System Maintenance Checklist – Tasks, Compliance & Digital Execution
January 1, 2026
Bench Grinder Maintenance Checklist – Tasks, Safety & Digital Execution
January 1, 2026
Warehouse Maintenance Checklist – Tasks, Systems & Digital Execution
January 1, 2026
Press Machine Maintenance Checklist – Tasks, Tips & Template
January 1, 2026
Fire Suppression System Maintenance Checklist – Tasks, Compliance & Digital Execution
November 26, 2025
New version 3.18 – Asset upload, new asset owner persona, and downtime tracking
January 1, 2026
Manufacturing Plant Maintenance Checklist – Tasks, Tips & Template

January 20, 2026